Search
Beer Inspector AI: How to define a "good" beer? (Part 2)
Welcome again, dear Beer Lovers! This is the second and last part of our fairytale journey in the land of clean, soft water, flavourful hops, and colour-adding yeast — the land of beer!
In the first part, we have briefly introduced our computer vision project, called Beer Inspector. A tool that objectively estimates the quality of drafted beer from a photo, creates complete documentation and reports to the customer. Now it's time to be a bit more technical and point out the structure of the machine learning heart of the project!
An infinite number of mathematicians walk into a bar.
The first one orders a beer.
The second one, half a beer.
The third one, a quarter of a beer.
The barman says, "you're all idiots", and pours two beers.
As we already know, there are three main visual indicators that we should focus on - beer ratio, beer head structure, and beer head lacing.
Let's get started and shed some light on the technical solution of each of them!
Beer Ratio
On paper, the beer ratio seems like a simple task to do. Just look at the glass, and that's it! Was enough beer drafted into the glass to overlap the line mark on it? Yes? Excellent, good job, bartender!
Unfortunately, as we already know from the first article, this does not have to be correct. Many beer brands have defined the correct beer line as a range between two points on the glass.
The second issue is that in real life, we can just turn the glass around until we have both line points in front of us. But that is not possible with only one captured image!
Here comes the first challenge: how do we correctly detect beer ratio from one image if we don't want to bother the user with specific instructions on how to take a photo?
And how to address all possible shooting heights and lens curvatures since these two parameters drastically change the visible beer ratio as well?
Don't worry! Since you are reading this article, the solution does exist! Or does it (*read in Michael from Vsauce's voice)?
The heart of successful beer ratio classification is a deep convolutional neural network (how typical in the late 2010s). This tool provides us with correctly detected bounding boxes and roughly detected masks of the whole beer glass and the beer head.
Believe it or not, that's all that we need for correct beer ratio classification! After receiving all the detections required, we can deal with the first general photo problem, incorrect rotation. That's where the detected mask of the whole beer glass comes at hand. We can easily rotate the image to have the beer glass mask vertically straight in the photo.
Great! Since now we have the beer glass straightened, we can calculate our first beer ratio! By calculating the heights between detected bounding boxes, we can easily achieve our first results.
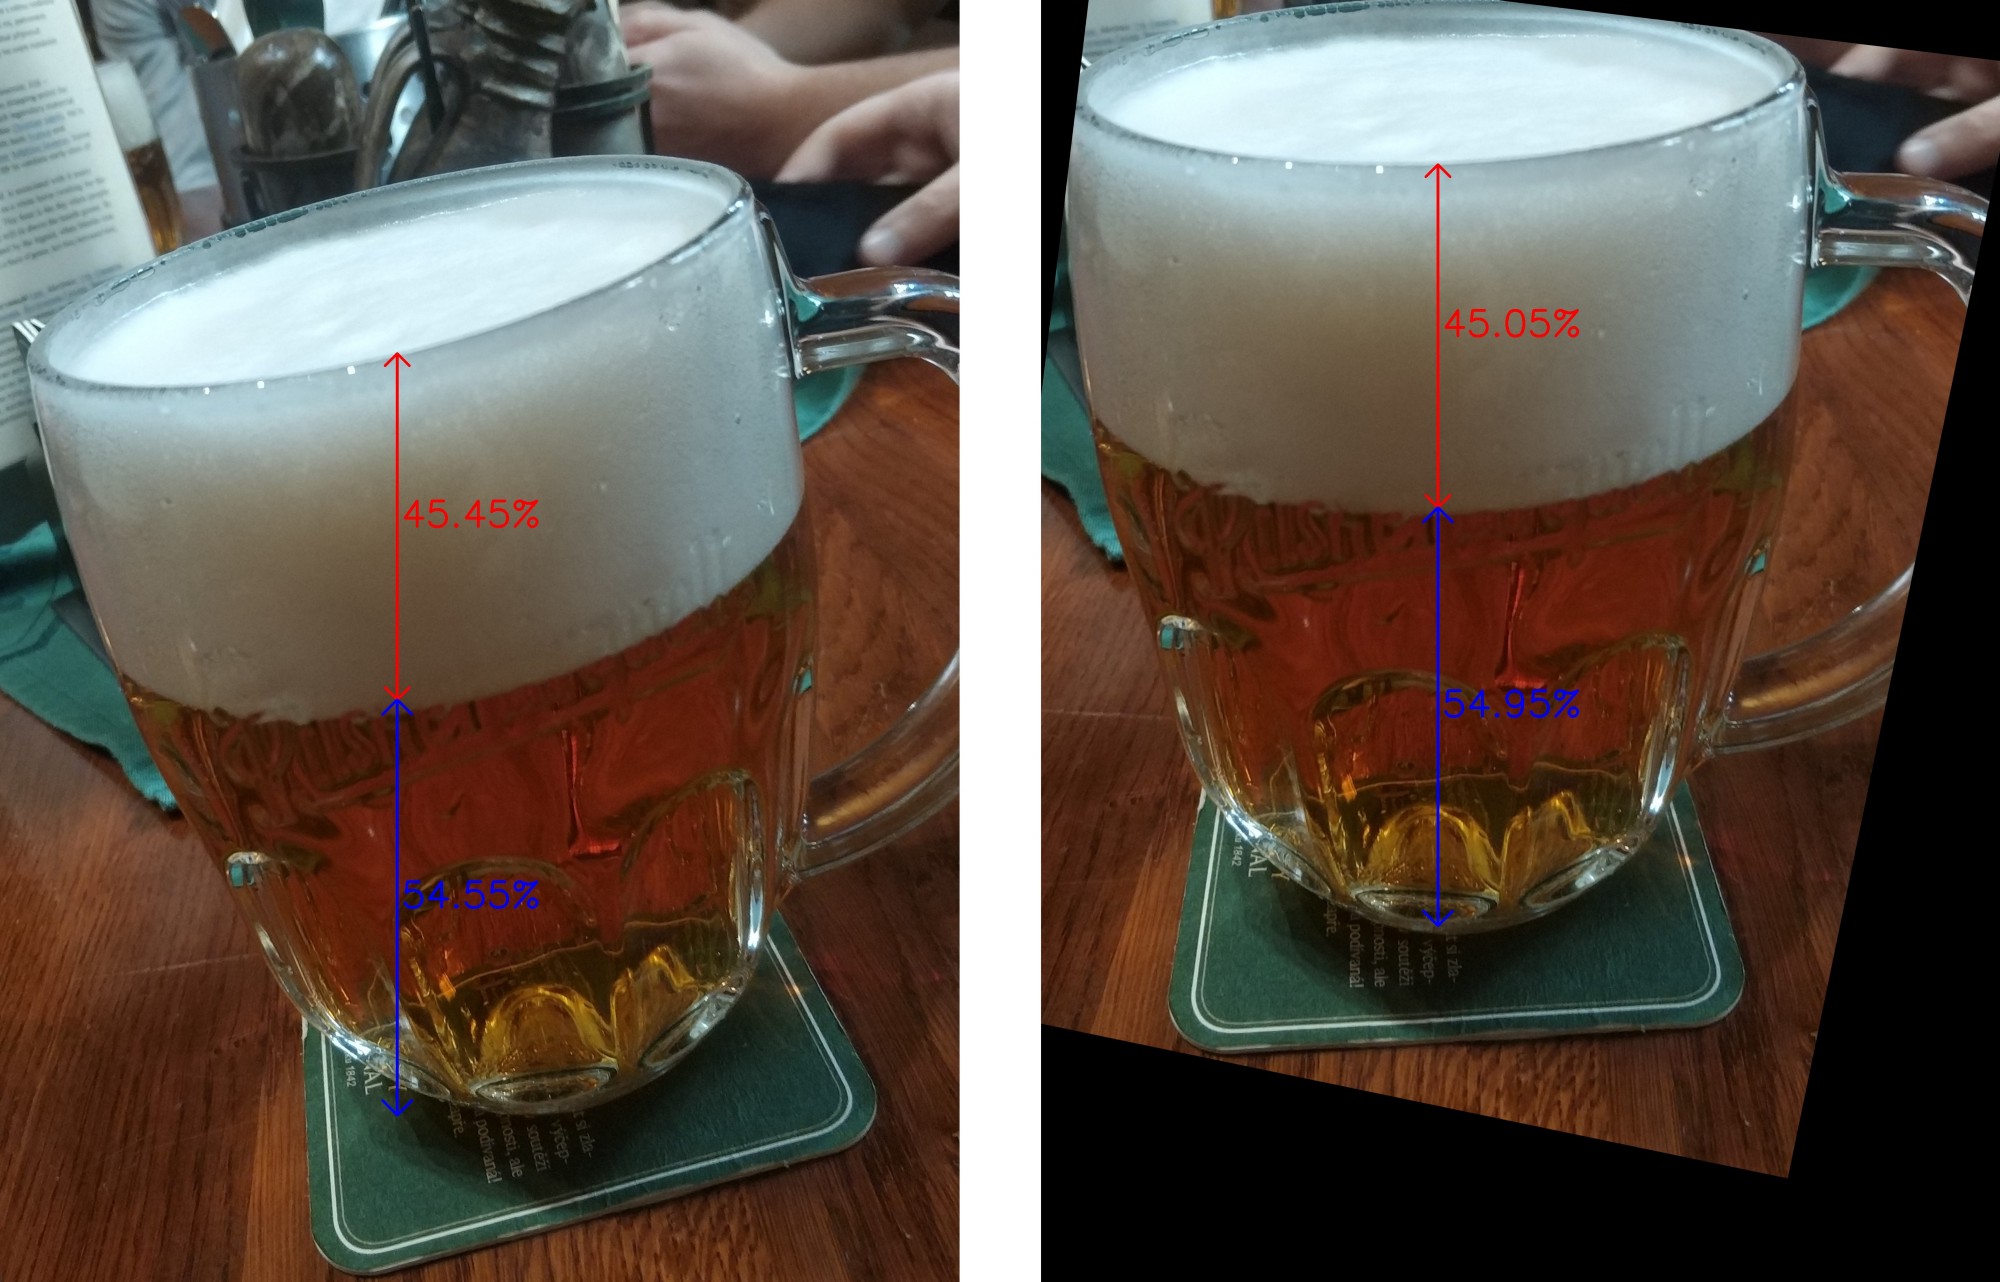
Rotated image with incorrectly detected beer ratio on the left, and its correction
on the right after mask vertically straightened.
And now, there are two additional issues that we have to take into account, all possible shooting heights and lens curvature. Since our calculations rely on detected bounding boxes, these values will differ if we shoot the beer glass from sky-high or nearly under the table, really close to the glass or one football field away!
The easiest way of dealing with these issues is to run several experiments. You can take a photo of one beer glass from different heights, and the beer ratio should be the same for all photos. The correct value is when the beer glass faces you straight. Now you can create a model for different shooting height dependency (for example, depending on differences between detected bounding box heights ratio) and start adjusting the heights of new incoming photos!
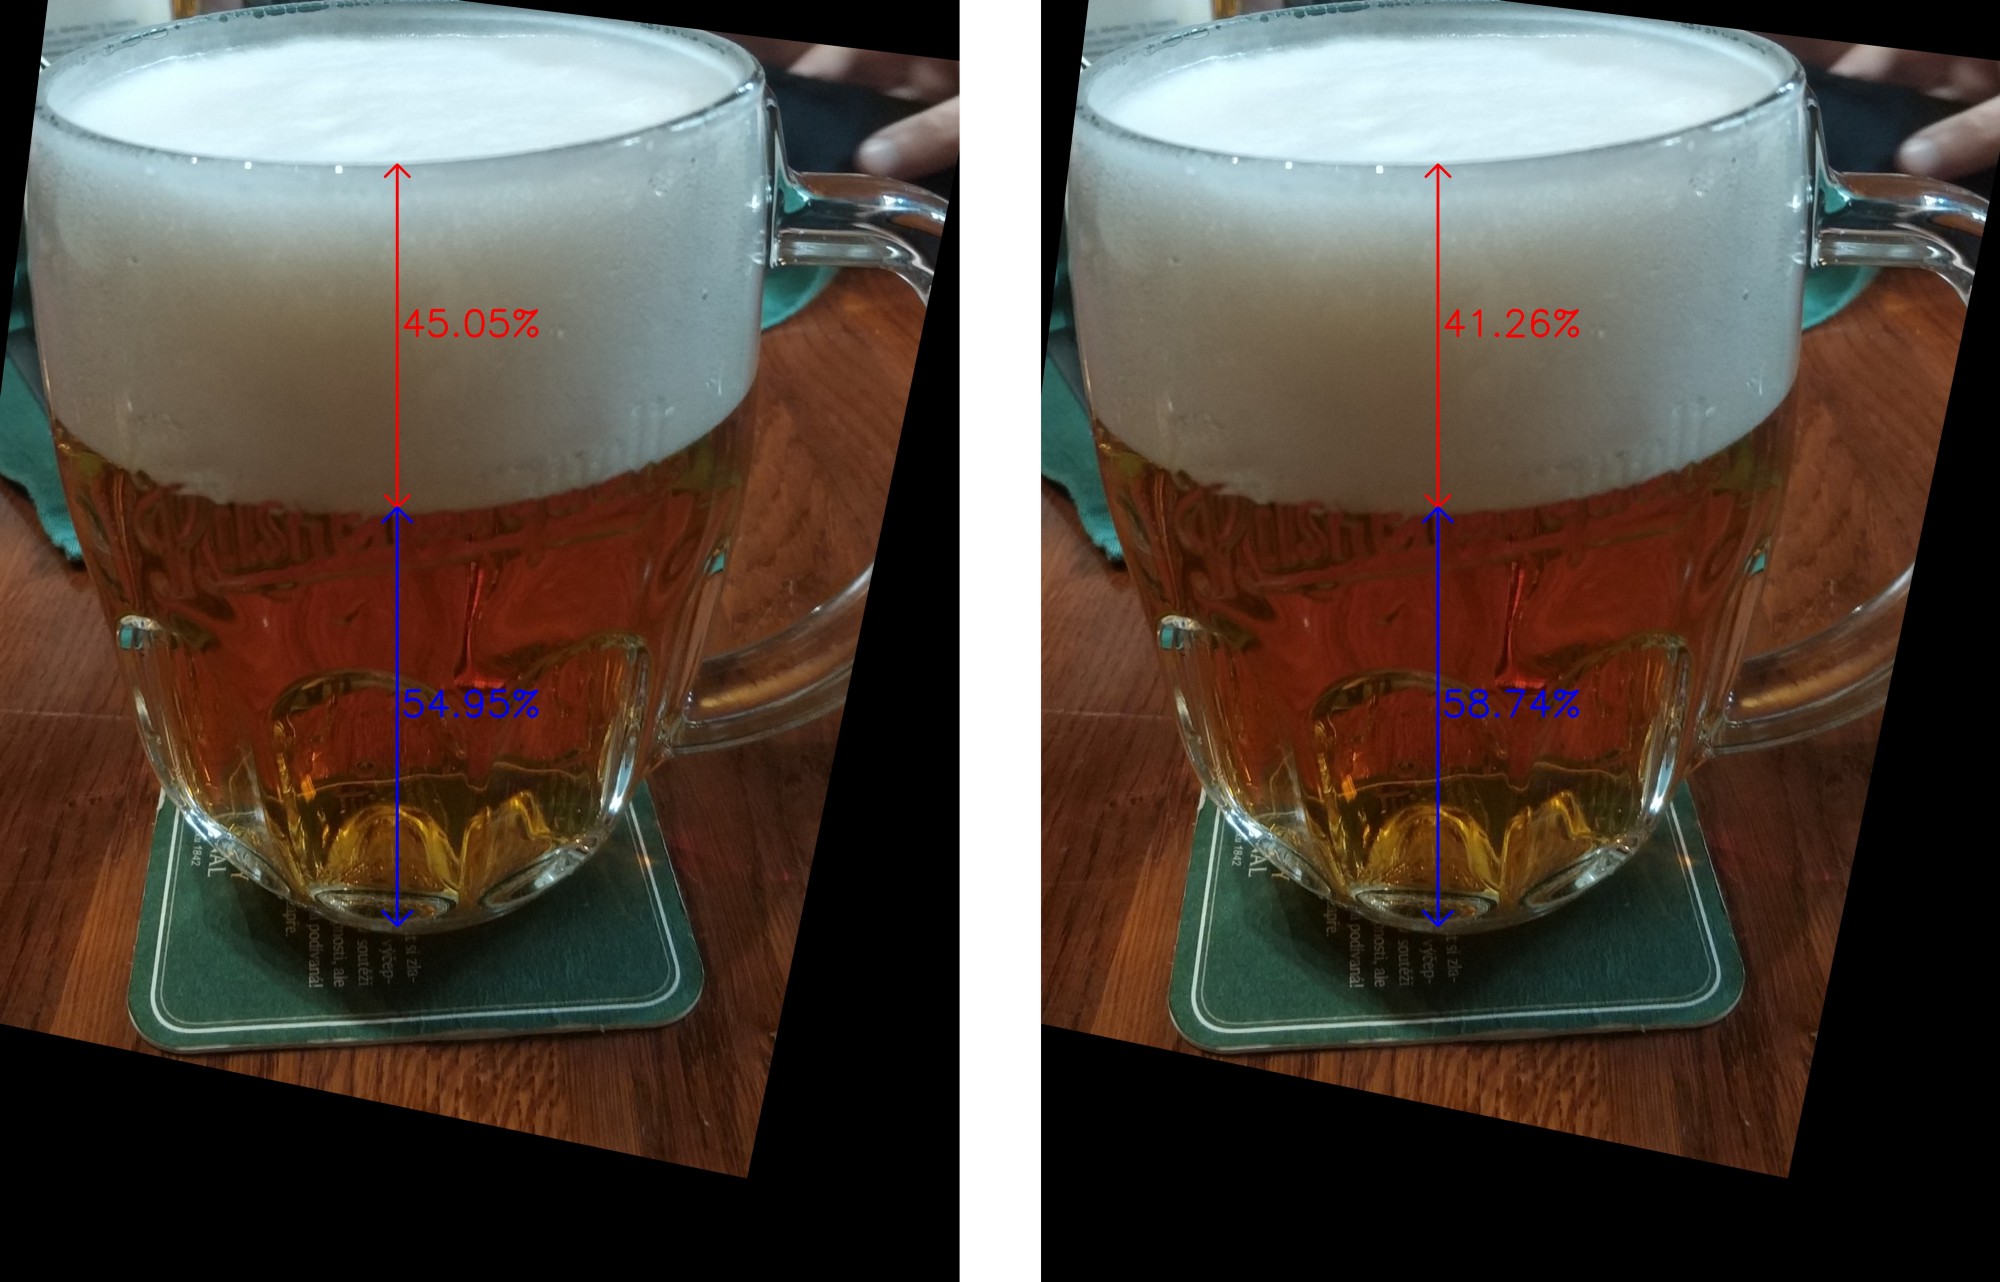
Correctly rotated image without a perspective fix on the left and with a perspective fix on the right (quick check: from this shooting angle, we know that there is actually more beer in the glass than it actually appears on the photo).
And it is a similar story with different lens curvatures. For this task, we have created a ramp that represented shooting from different distances. This way, we received general lens curvature dependency (used many different lenses) and again applied it to adjust the incoming beer ratio. Voilà!
Beer Head Structure and Beer Head Lacing
Beer head structure and beer head lacing are two critical metrics that objectively give the drafted beer's quality status but are often overlooked by the customers. They represent the overall quality status of the beer drafting, correct beer tap setting and cleanliness of its valves, and not exceeding the use of soap during beer glass washing.
But let's start from the beginning - what is the beer head's purpose?
A beer head is the flavour protector! It is a blanket over the drafted liquid that saves all ingredient's flavours from escaping the beer glass. More technically, the beer head acts as a lid that prevents the carbon dioxide (visible as bubbles in the beer head) from evaporating from the beer in the glass.
Now, from the other side, it prevents the beer from oxidising too quickly. This leads to a change in the beer flavour. Also, air exposure equals adding temperature to the divine drink more quickly. Simply - who wants to drink warm beer?!
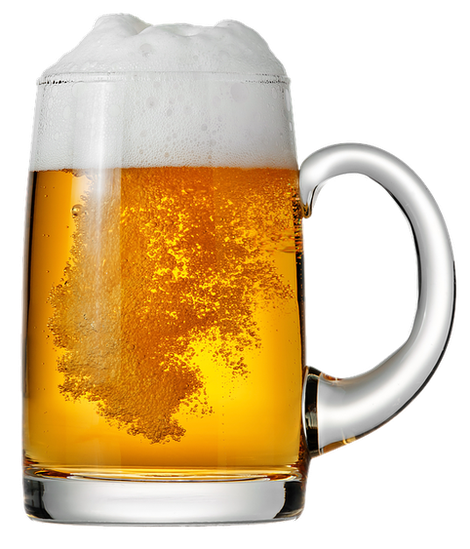
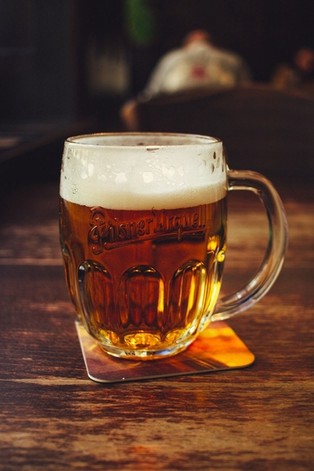
Is it the correctly drafted one? Well, I can see some bubbles…
The bottom line is that it is easy to see what the ideal beer head should look and act like. It should be thick and sturdy! And that directly corresponds to the beer head lacing! The thicker and sturdier your beer foam is, the clearer and more visible beer laces are after every sip.
Finally, back to our favourite topic — issues time! Since we don't want to make the user document the whole beer lifetime to achieve all info about the beer head structure and how it acts after a few minutes, is there any quick way of obtaining it only via a few photos? (Hint: Yes, there is!)
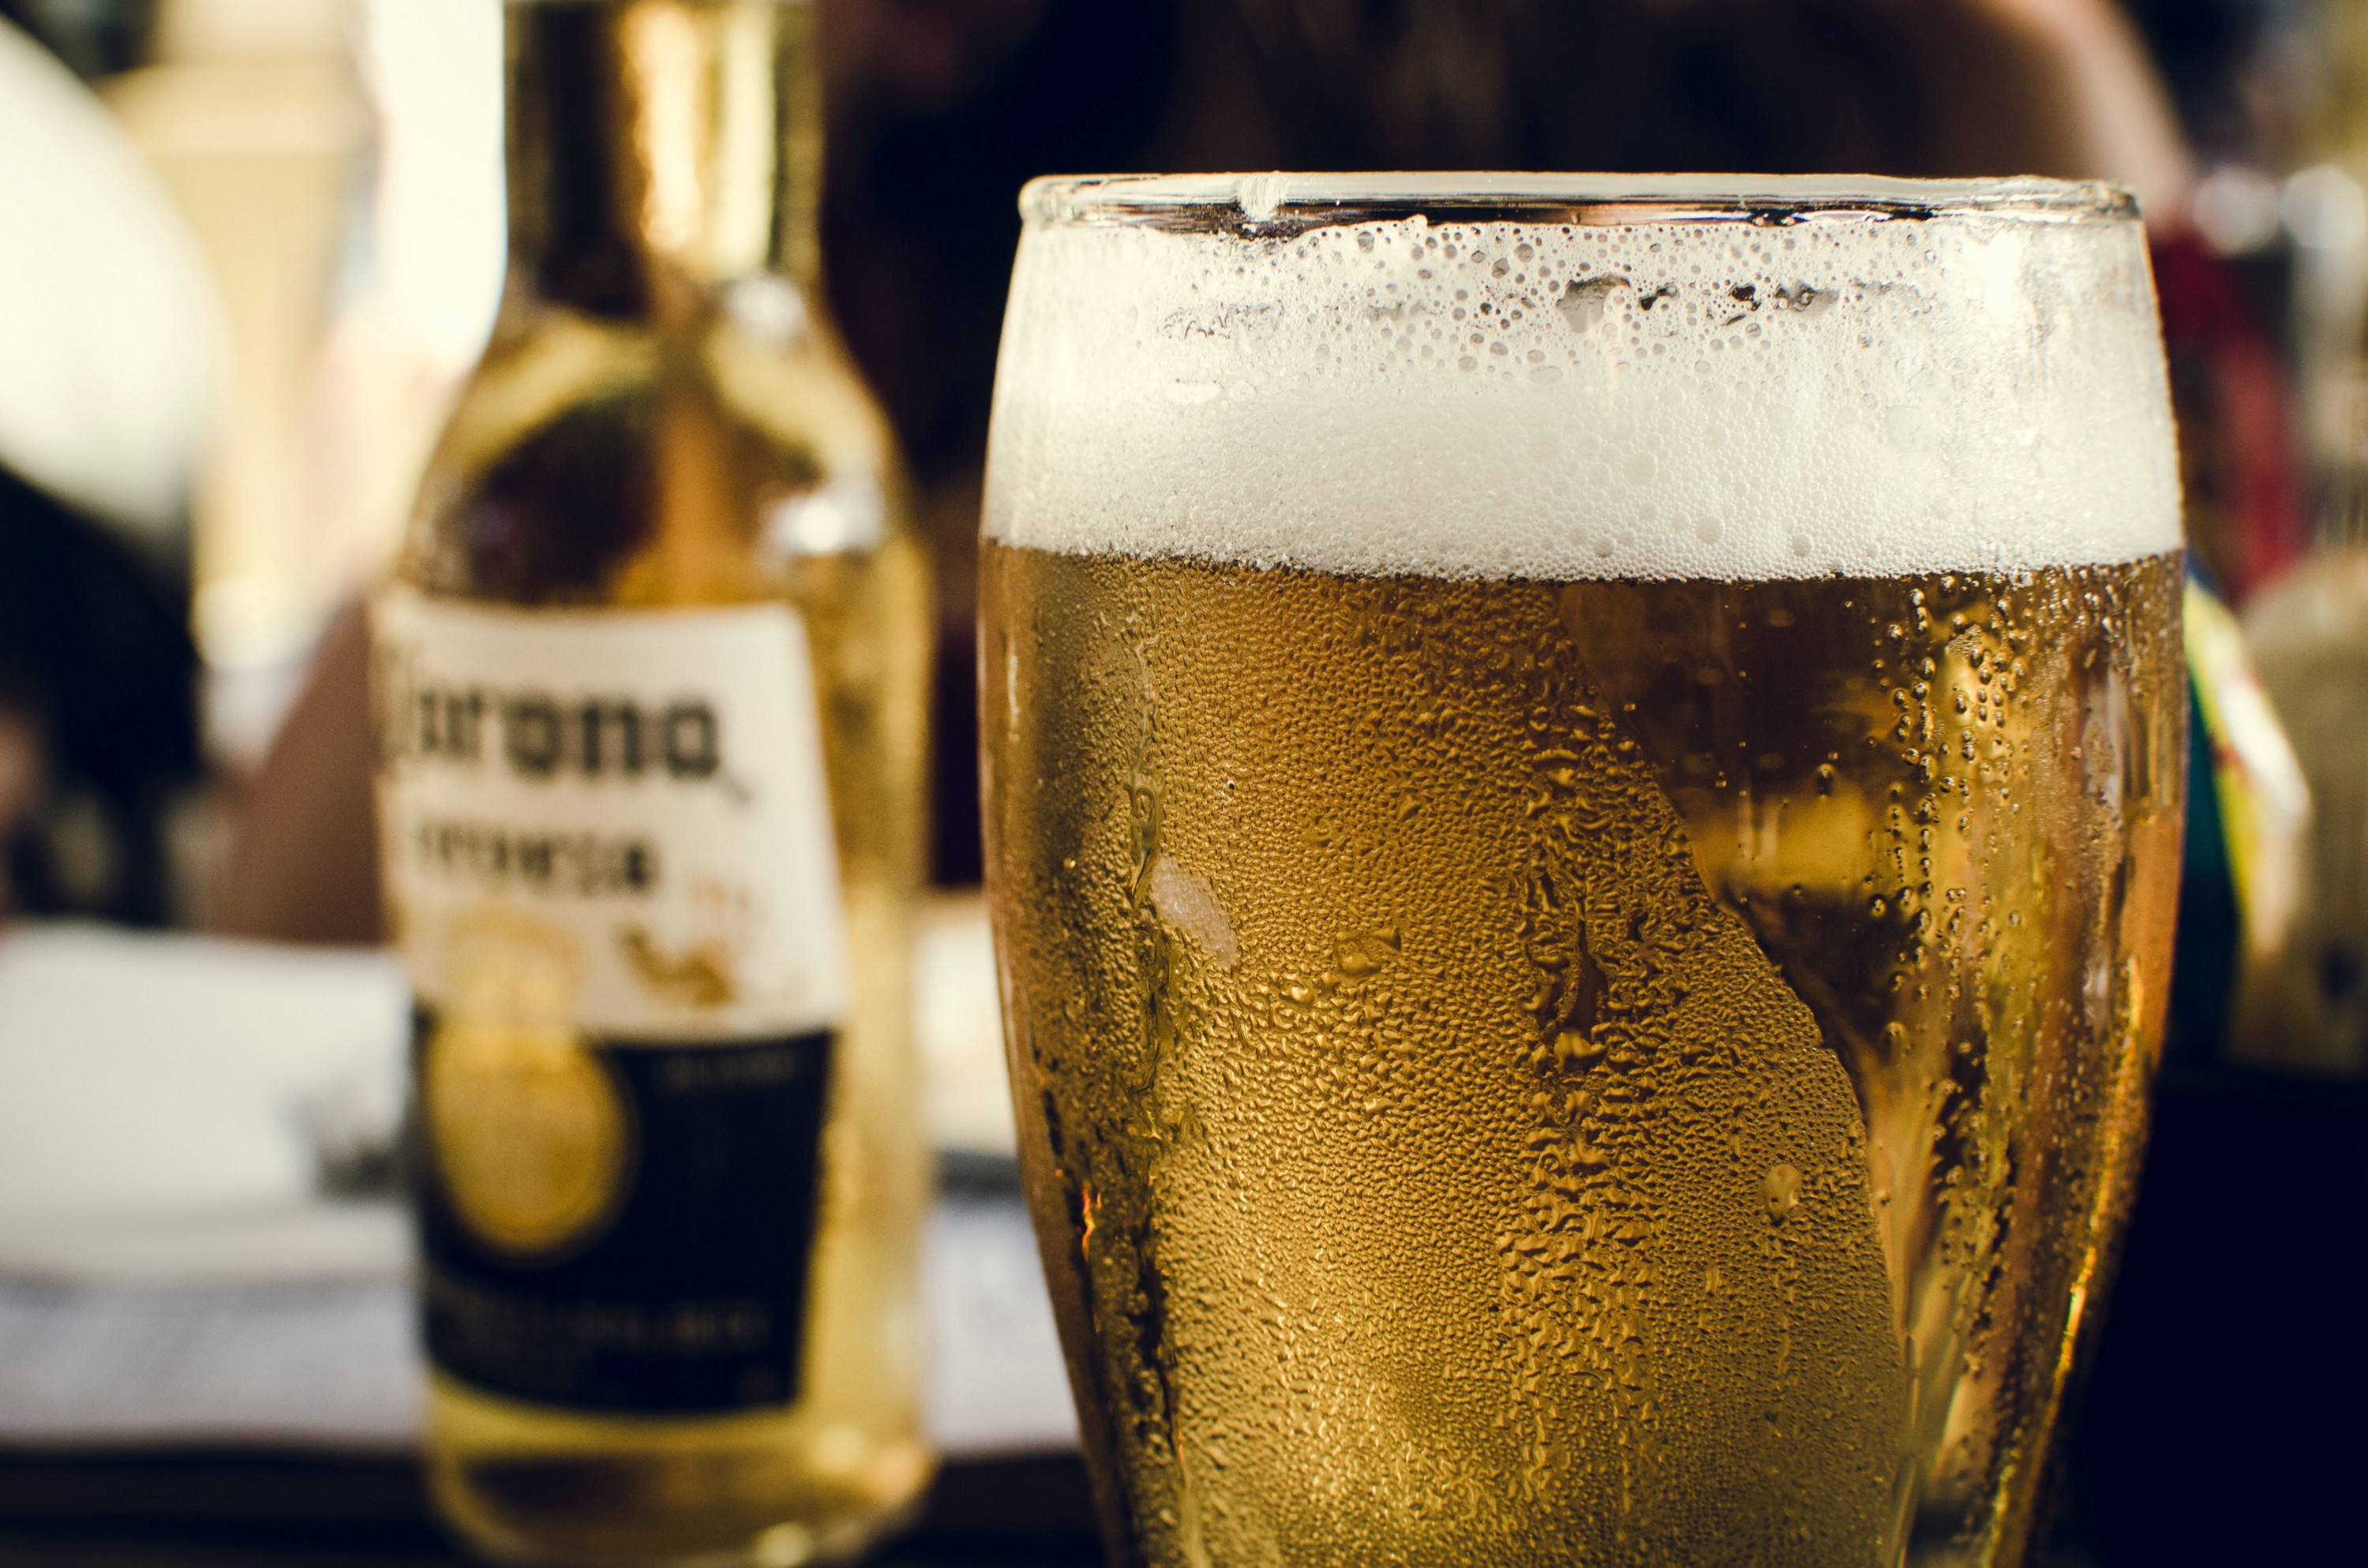
Notice that structure in the bear head
Bubble time! Oh, how I love bubbles…. But not in my lager's head! The large amount and size of carbon dioxide bubbles in the beer head mean much quicker beer head loss. They disrupt the beer head's structure, which gradually causes losing the beer head and facing a warm drink. This partially translates to the beer head lacing as well, since if there is no beer head, there are no beer head laces (duh).
So, how do we classify a good or a wrong beer head structure and lacing?
First of all, the beer ratio is precisely defined as whether it is good or not. For beer head structure and lacing, even beer brewers are not united with the expected classification outcome. For some of them, a few large bubbles in the beer head do not matter that much. For the rest, however, even one big bubble might already be a sin. Sometimes a large amount of small bubbles in the head is acceptable, sometimes it is not.
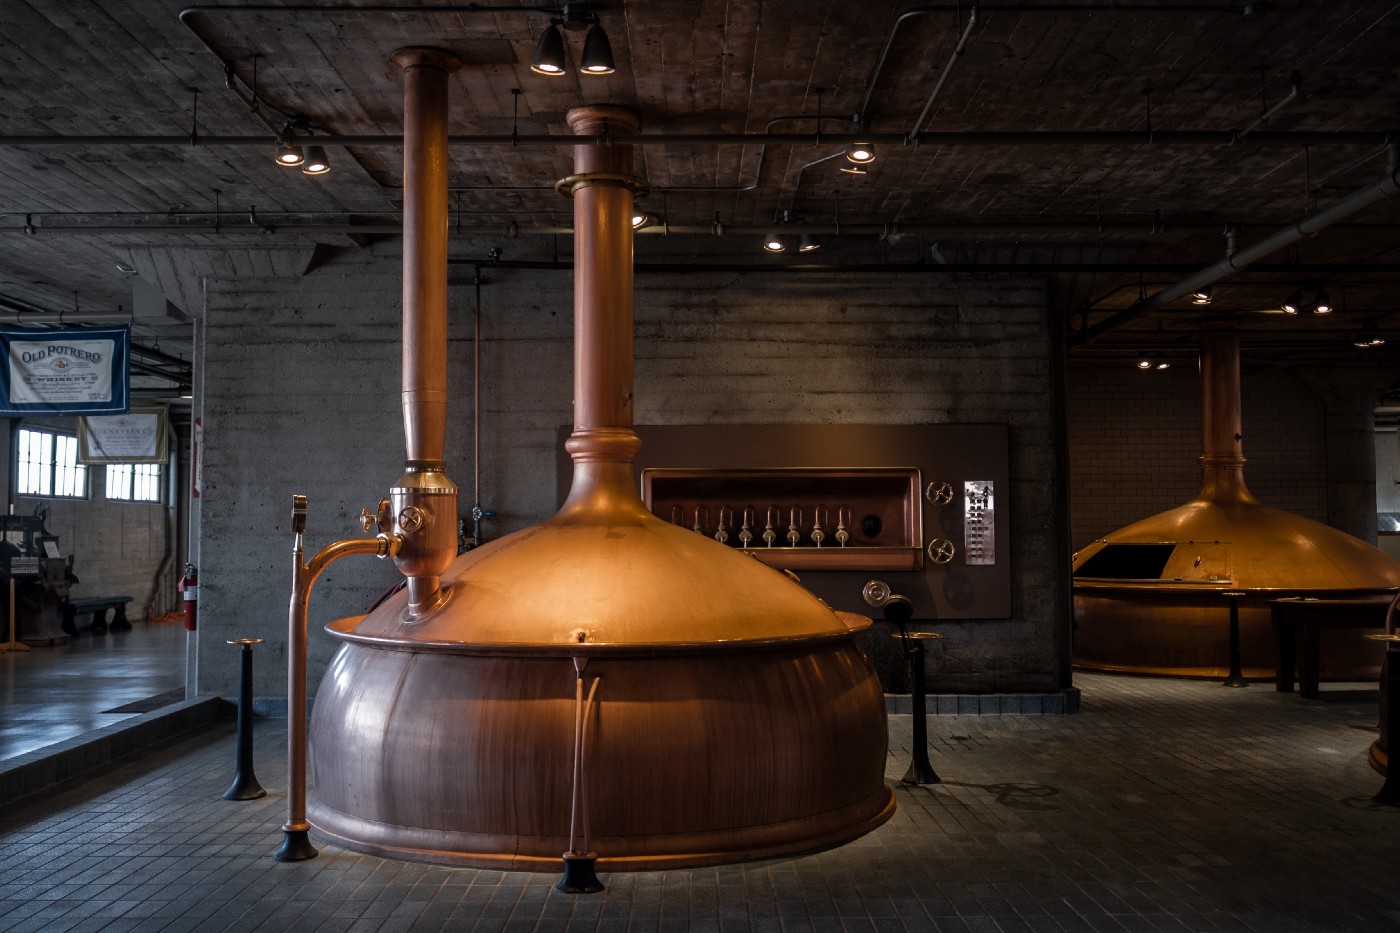
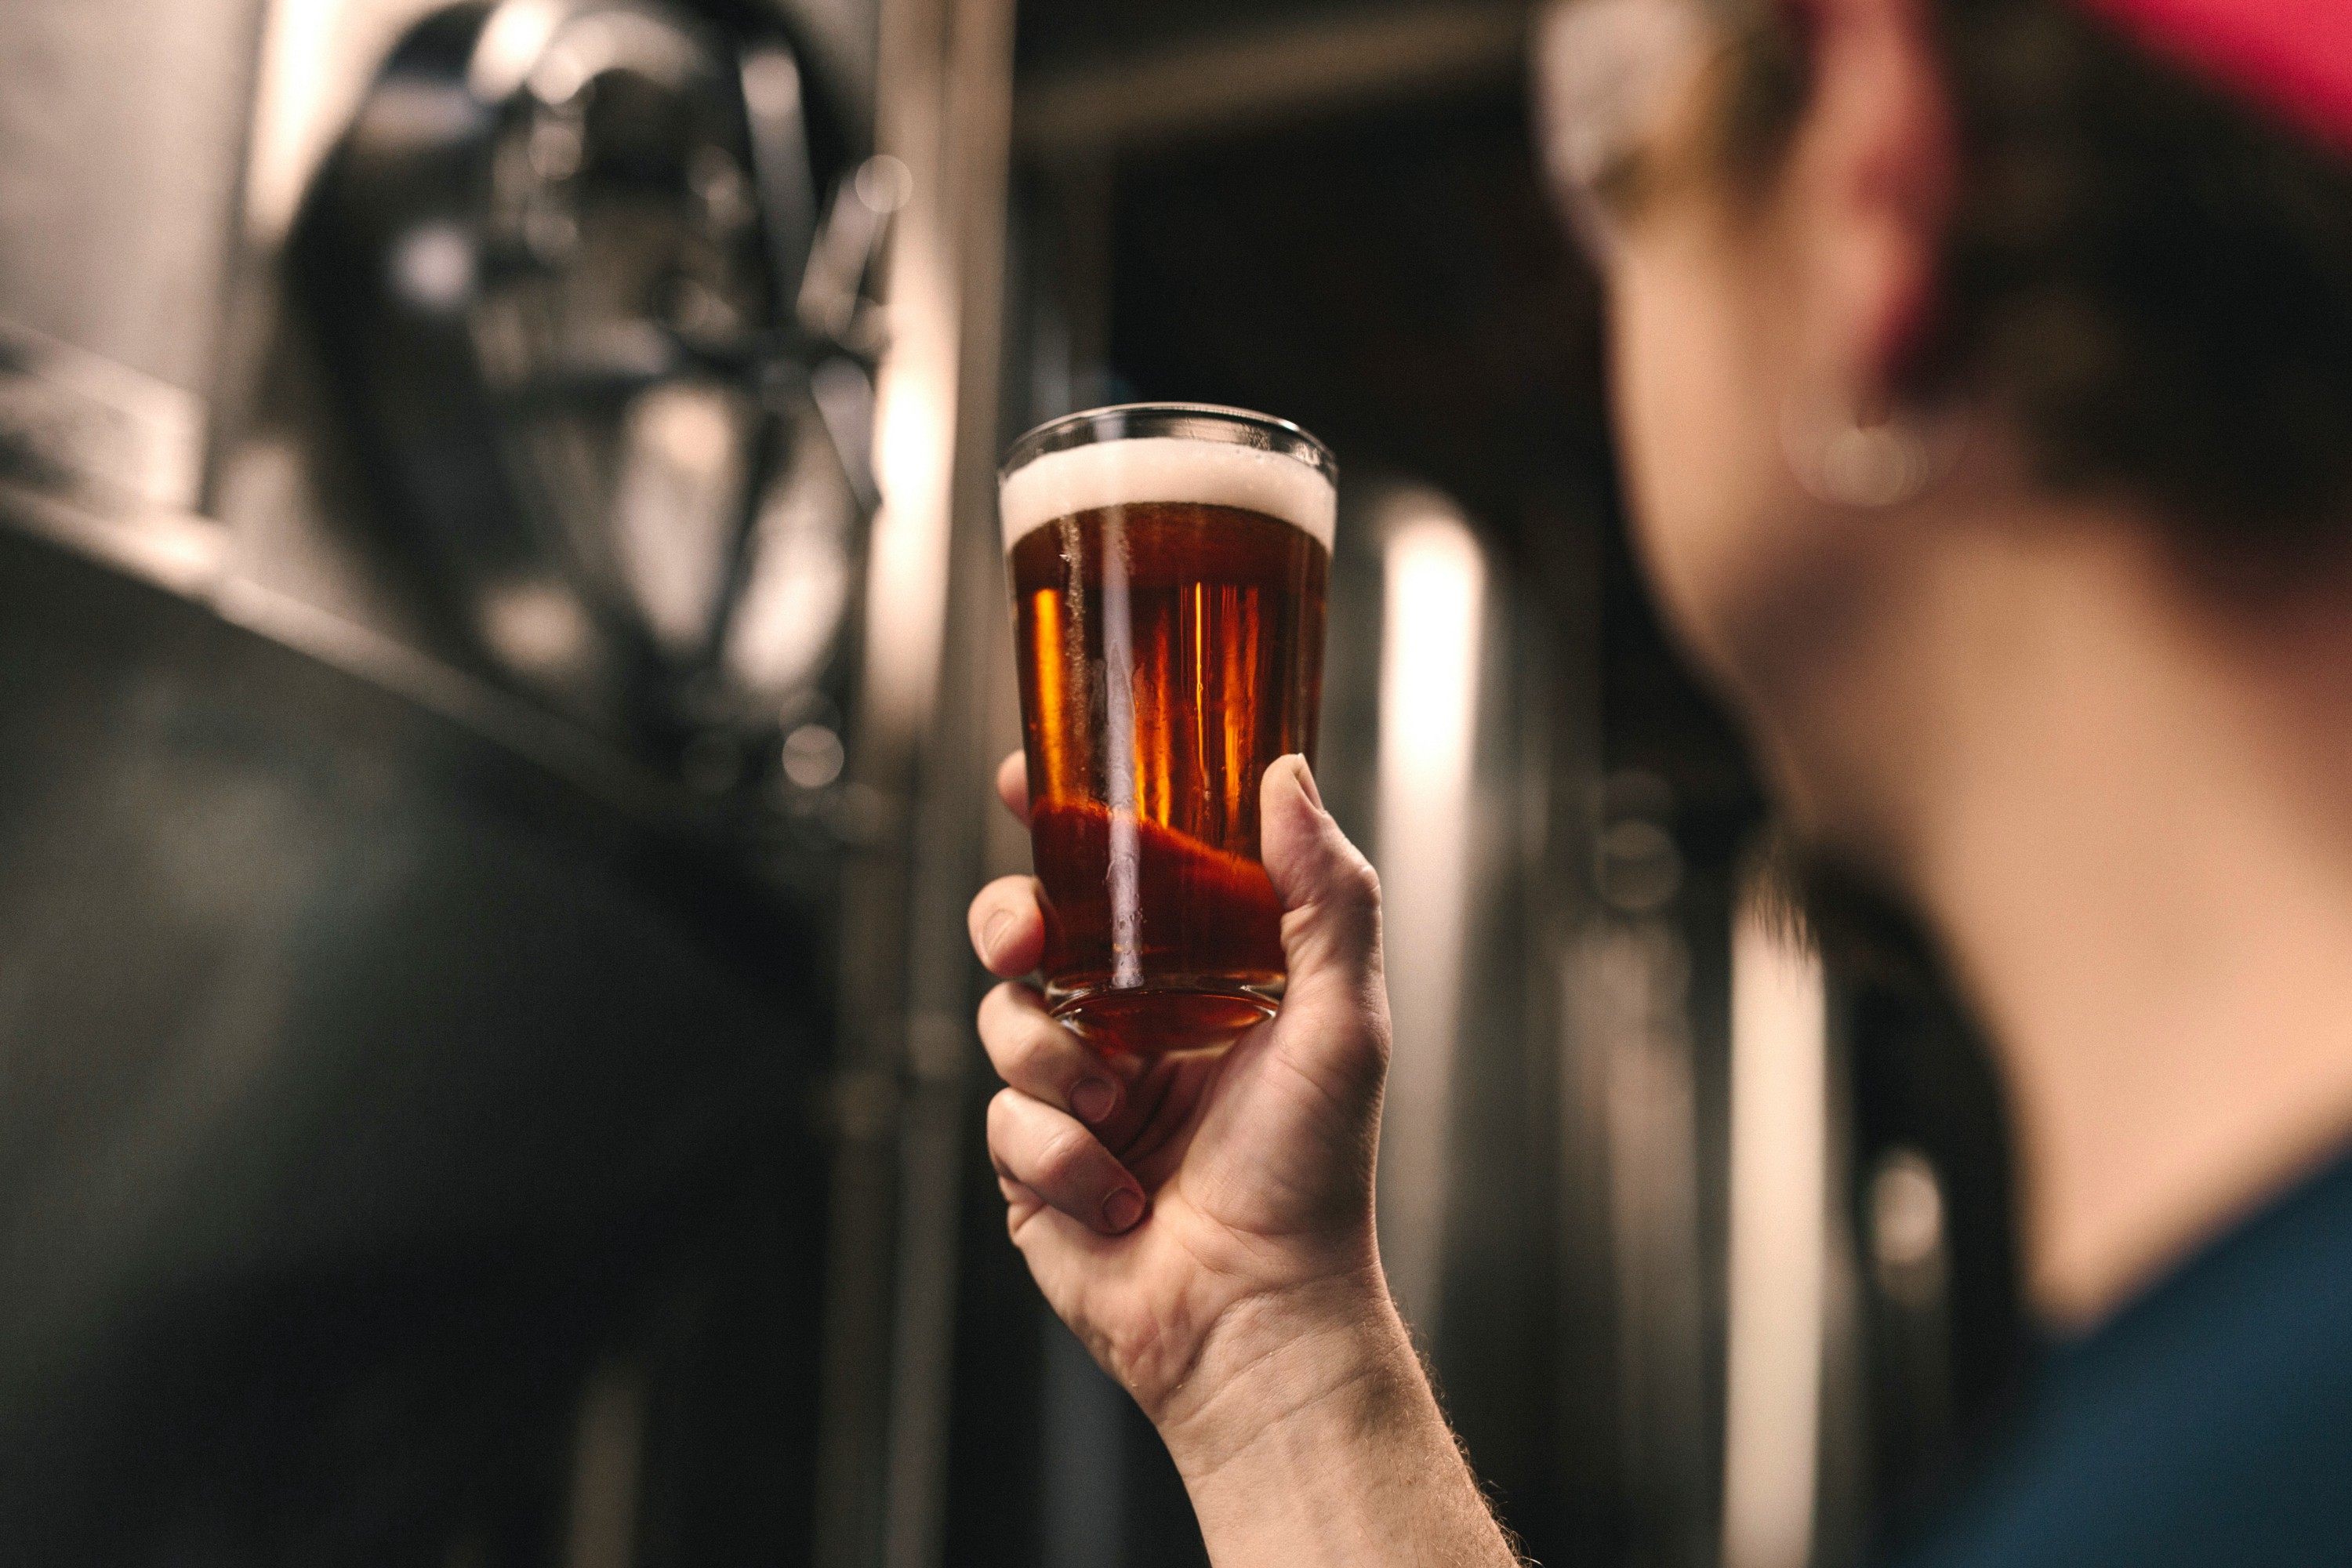
Beer brewery
Therefore we've abandoned the idea of classifying beer head structure and lacing as only good or bad, so we had to develop a more objective approach. After the beer glass/head detection (pre-hint for the technical solution), we divide the detection into many smaller fragments, cutouts of the detection, and then classify them instead! This way, the uncertain decision about whether the specific cutout is good or bad does not significantly impact the detection classification.
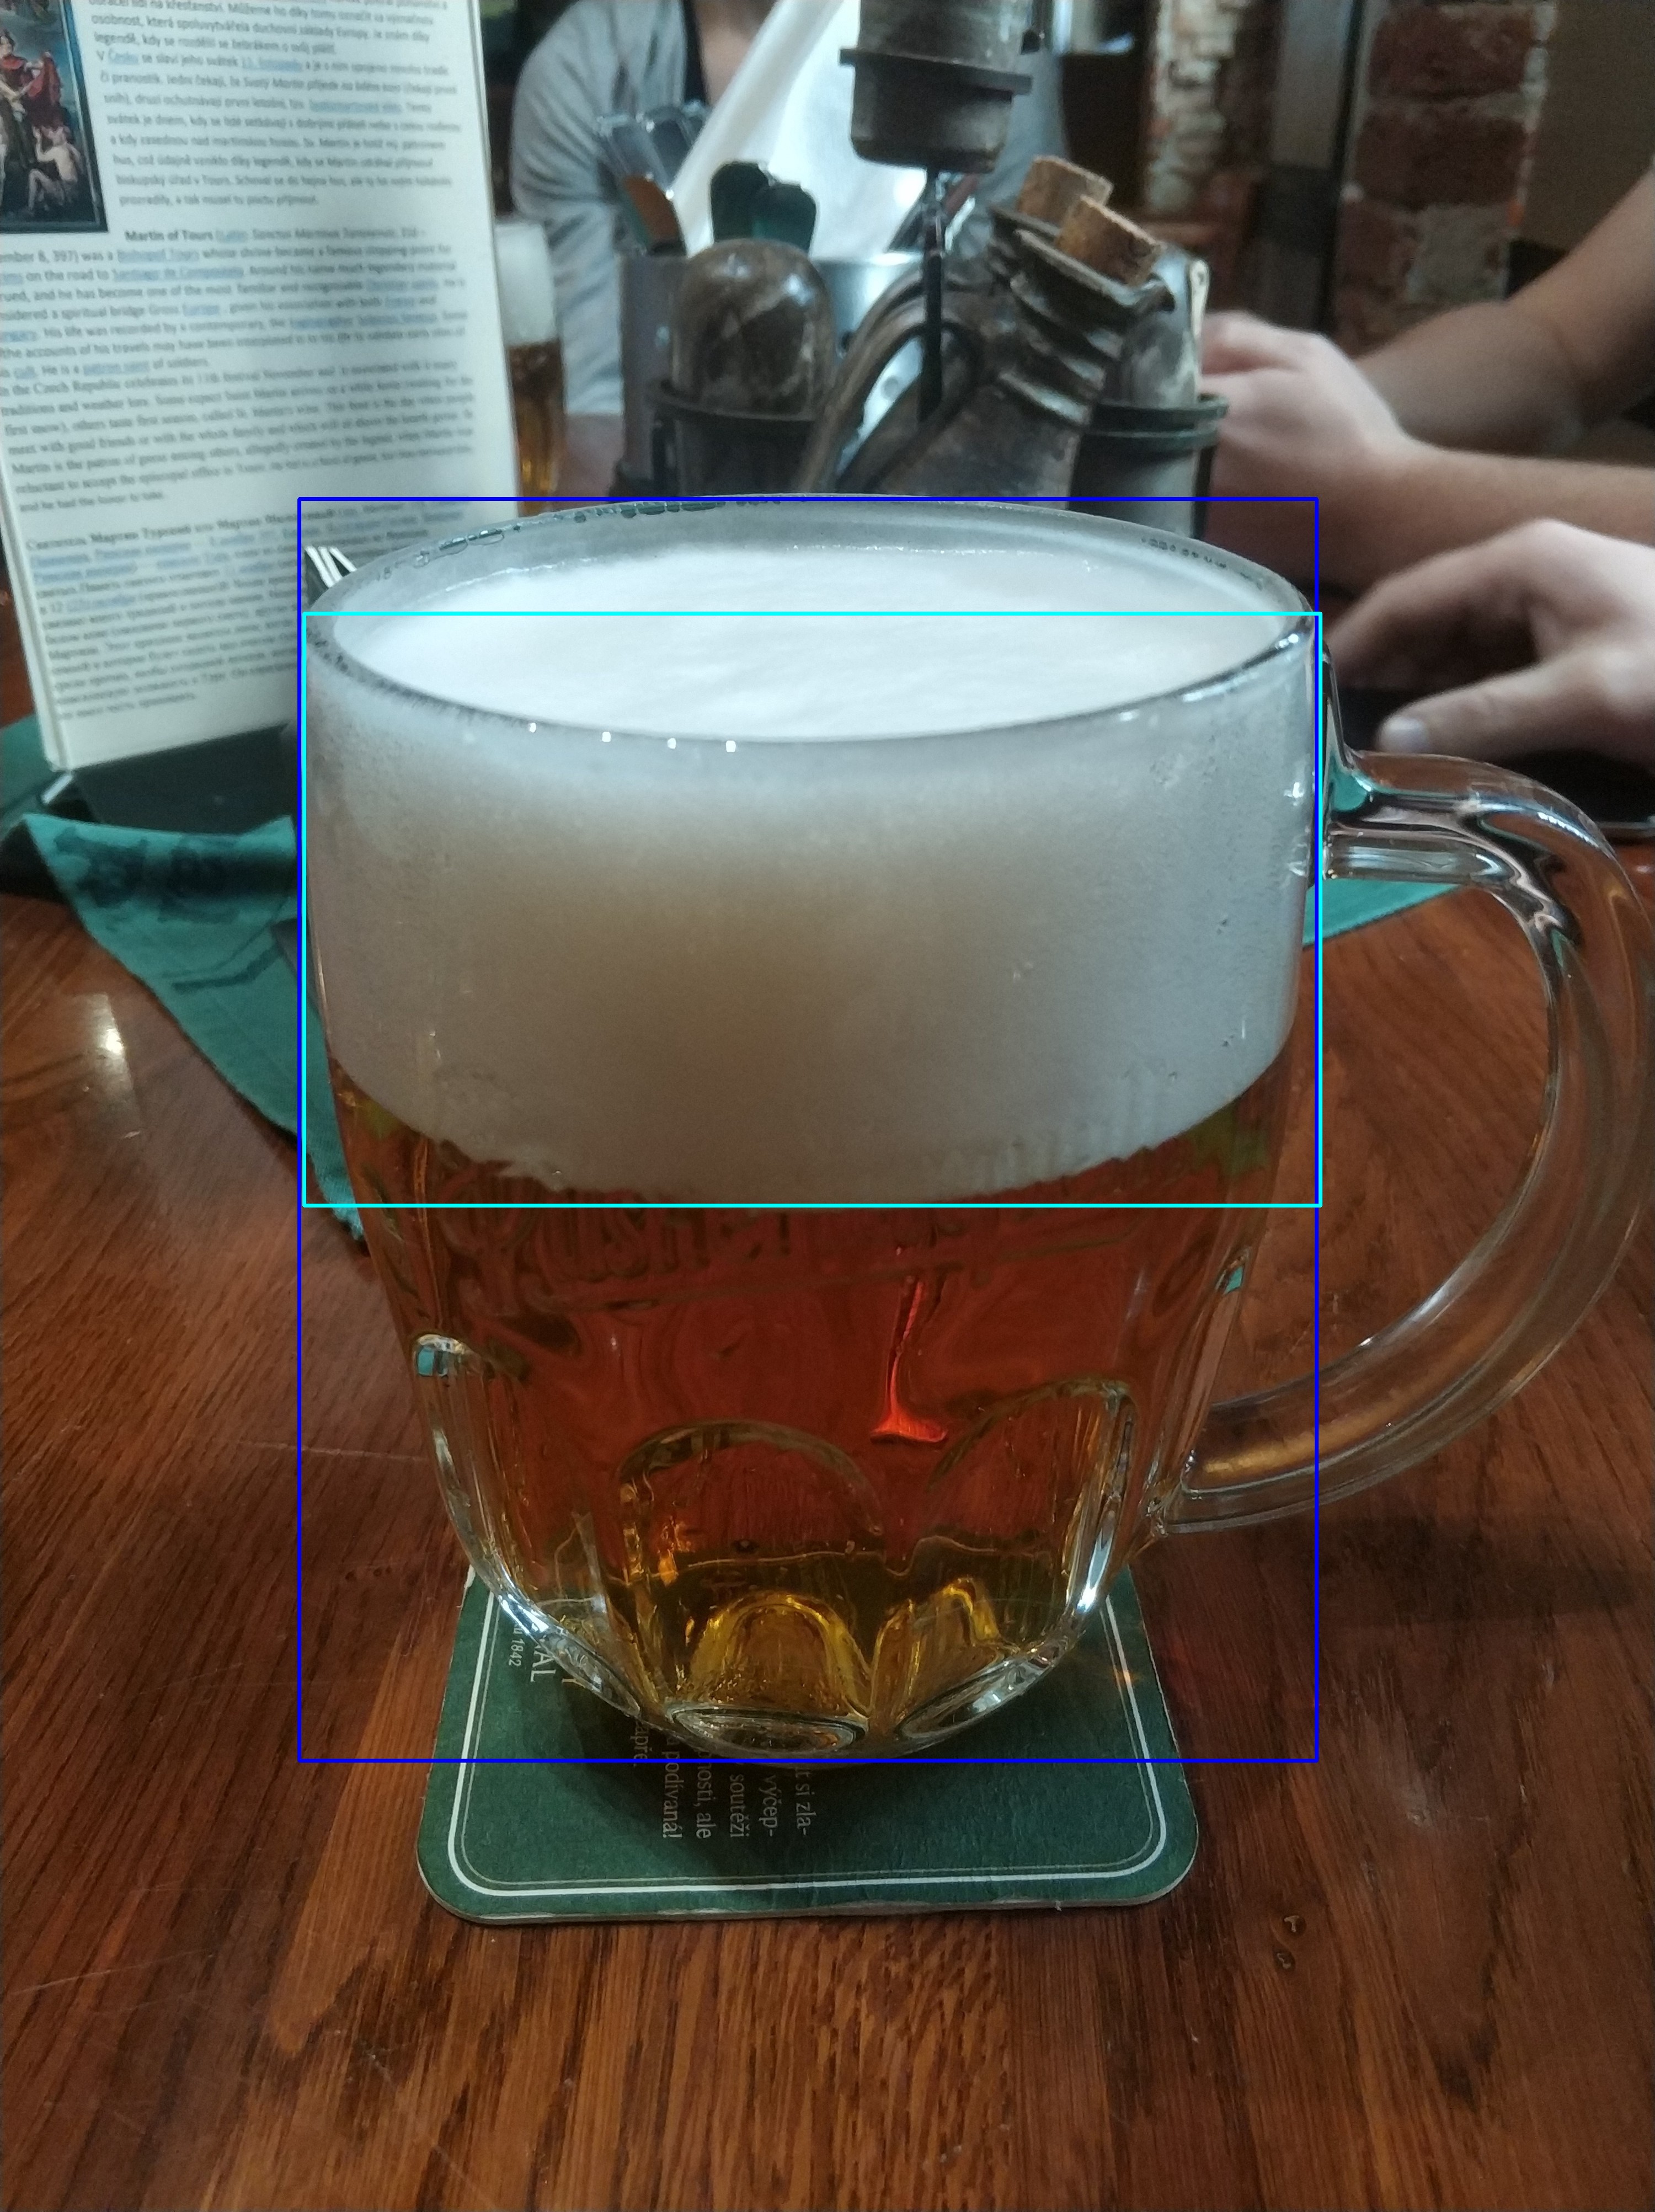
Beer with detected bounding boxes - the whole beer glass and the beer foam only.
The starting point for both metrics is similar to the beer ratio, a deep convolutional neural network that detects bounding boxes (masks are not needed). For the beer head structure, the bounding box of the beer head is extracted. For lacing, it is the whole beer glass.
Now we can cut these detections out of the input images and start playing with them! Most of the neural network classifiers (spoiler alert) use a square image input. Therefore, the next step is to make an optimal square image grid of this cutout. In our case, we selected the number of grids to be 40, so the grid can be 5x8, 4x10, and so on.
Finally, we have everything ready to start classifying! Now, it is much easier to decide the beer head structure's faith. Are there too large or too many bubbles in the specific grid segment or not? For the beer head lacing, there are three detected classes. It is either the grid with lacing, without it, or, since we detect the whole glass, there is an "other" class for the beer itself or, for example, the brewer's logo on the glass.
After trying many different methods and techniques for classification, we have decided to use another neural network. This time for classifying correct or incorrect beer head structure and correct, incorrect, or "other" for beer head lacing.
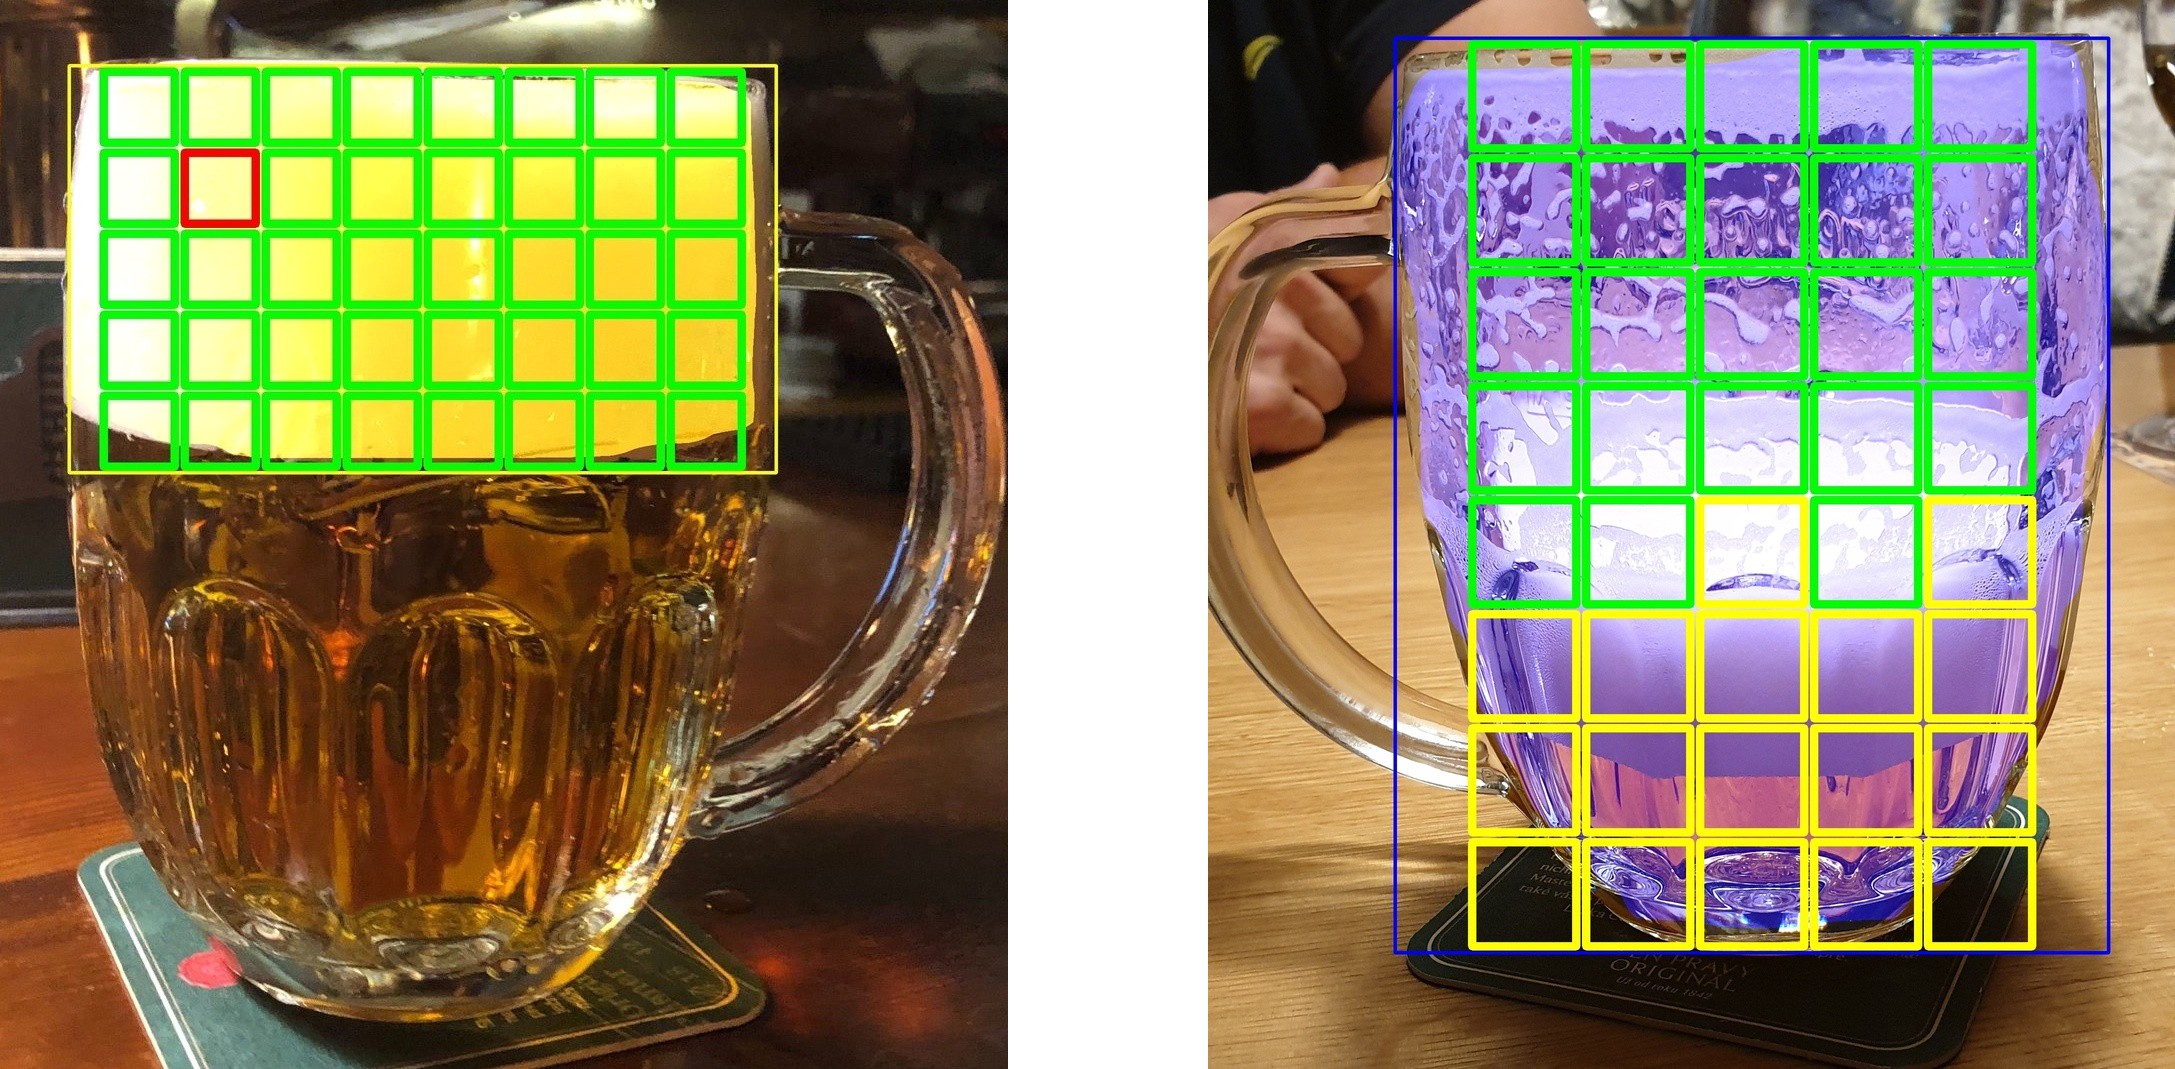
On the left: classified beer head structure; on the right: classified beer head lacing. Green squares correspond to correct grids, red to incorrect ones, and yellow to "other".
And here it is! Now, we only need a threshold for how many correct/incorrect grids well-drafted beer is allowed to have!
Bottom line
Wow, great job! You have obtained all the needed results for the decision! Did your drafted beer pass all the tests? It did?! Fantastic! Let's meet at this place again! Oh, it did not? Well, I've seen an interesting pub near the ….
In the end, we can send all the results to our database and run statistics to see overall results per a pub, restaurant, beer or brand. Also, we can easily record some global issues with beer brand delivery (e.g., barrel issue, not suitable beer tap, or incorrect setting) — all thanks to our Beer Inspector!
And now you know everything! In the first article, you have found out all the business advantages of our internal project, Beer Inspector, and the principles of a correctly drafted beer. Today, we have extended these principles with more details and presented all technical info.
Any further questions, suggestions, or responses will be appreciated!